



Financial Analyst/Content Writer, RADEX MARKETS
Lawrence J. came from a strong technical and engineering background before pivoting into a more financial role later on in his career. Always interested in international finance, Lawrence is experienced in both traditional markets as well as the emerging crypto markets. He now serves as the financial writer for RADEX MARKETS.


AÇÃO


According to the Chinese Lunar calendar, the 17th of February 2026 marked the start of the year of the horse. Traders searching for an edge may ask themselves what this could possibly mean for financial markets, after all, as a certain Mr. John Pierpont Morgan once said: “millionaires don’t use astrology, billionaires do”. Strong words, and while there is no historical evidence of the famous financier ever uttering such a phrase, it goes without saying that investors can be a very superstitious bunch. The year of the horse comes around every twelve years, so there should be enough data points to establish at least a partial picture. So how does our four-legged friend measure up to the rest of the roster?
Lunar performance of the S&P 500
A fast, but skittish and fickle animal, the horse is hardly the kind of beast investors would want to represent their portfolios, but let us not be too hasty. How have markets fared during previous years of the horse? Using the S&P 500 as a benchmark, we can run the numbers for every lunar year dating back to the late 1920s, which is when Standard & Poor’s began publishing daily index data. The 23rd of January 1928 ushered in the year of the dragon, which would last until the 9th of February 1929, and so on and so forth, lunar year by lunar year until 16th of February 2026, which concluded the year of the snake. We can calculate the annual return for each period, and then average the results across each animal, as displayed below:
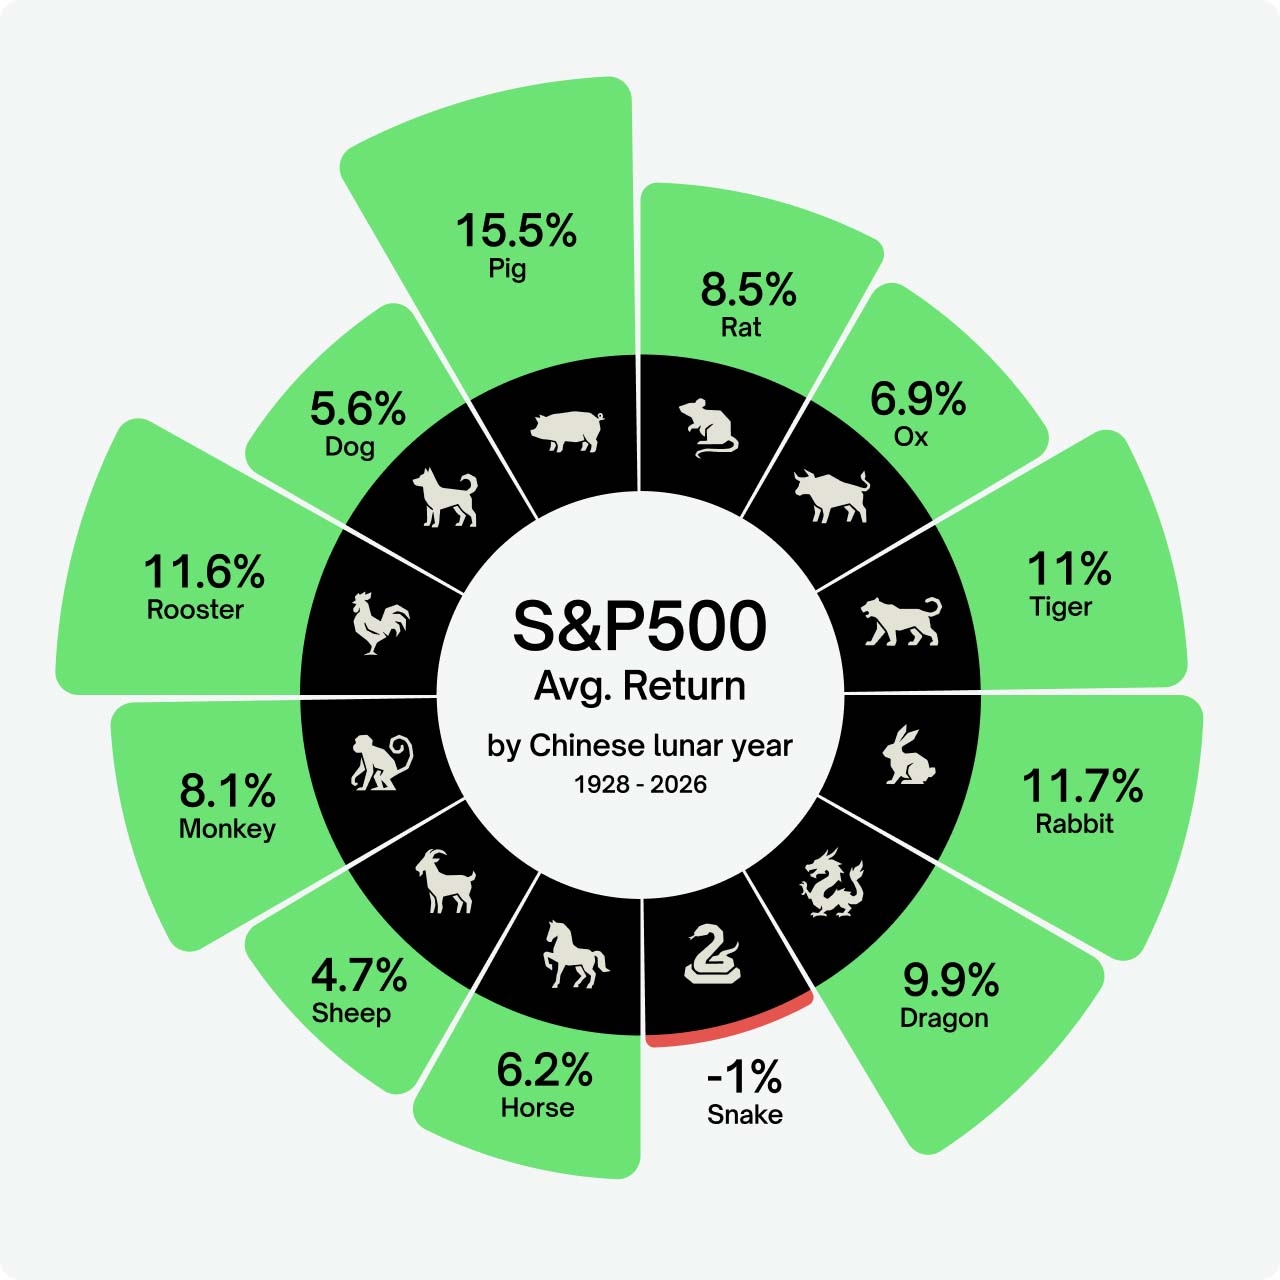
As per the above chart, at 6.2% the horse is a relatively safe bet, firmly in the middle of the pack. Reliable, but nothing exceptional. The clear winner is the pig, providing an average return of over 15%. The next year of the pig will come around in 2031, so mark your calendars for that. The clear loser is the snake, which is the only animal to yield an average negative return at -1%. Had it not been for the impressive surge in stocks last year, the year of the snake would look even worse.
Of course, even with a century of data, each animal has only 8 or 9 data points with which to pad their resumé, so outlying years will heavily skew the results. In fact, the first year of the horse for which we have records, starting on the 30th of January 1930, would experience much of the fallout from the great Wall Street crash of 1929, resulting in a 22% loss for the S&P 500 during that period. 2002 would be another rough year, with the horse bearing the brunt of the dot-com bubble burst, Enron fraud and September 11th attacks, during which the SPX would shed 23%. In contrast, our noble stead would also witness some of the strongest bull markets in history, such as the peacetime boom of 1954, which would yield a massive 37% return.
Quantifying volatility
The year of the horse seems to go from one extreme to the other, covering some of the most volatile periods in financial markets. Not only that, but such years typically exhibit large price ranges as well as far greater volatility than average. In fitting with their nature, horse years have historically offered plenty of action to traders.
By crunching the numbers, we can in fact quantify this phenomenon. If we take the tops and bottoms for each given period and divide by the mean, we obtain a measure of the spread in prices for each lunar year. Sure enough, by this metric, the horse is a wild beast indeed, offering large trading ranges over the course of its reign. Only the tiger provides a wider playing field.
Trading ranges are one element, but we can go deeper. To properly understand the trading conditions of a particular period, we need to quantify the market volatility during such times. To do this, we calculate the standard deviation (σ) of daily closing prices across each lunar cycle. This tells us how spread out the different prices are within the range itself. Essentially, this is a measure of how chaotic each year has been.
After calculating the standard deviation (σ) for each year, we then divide by the mean (μ) of that period, thereby normalising results and accounting for the huge growth observed in the S&P 500 index over the past century. This gives us the coefficient of variation, a quantifiable measure of the trading volatility within each given year. Finally, we average the coefficient of variation for each Chinese zodiac animal, expressed as a percentage, summarised below:
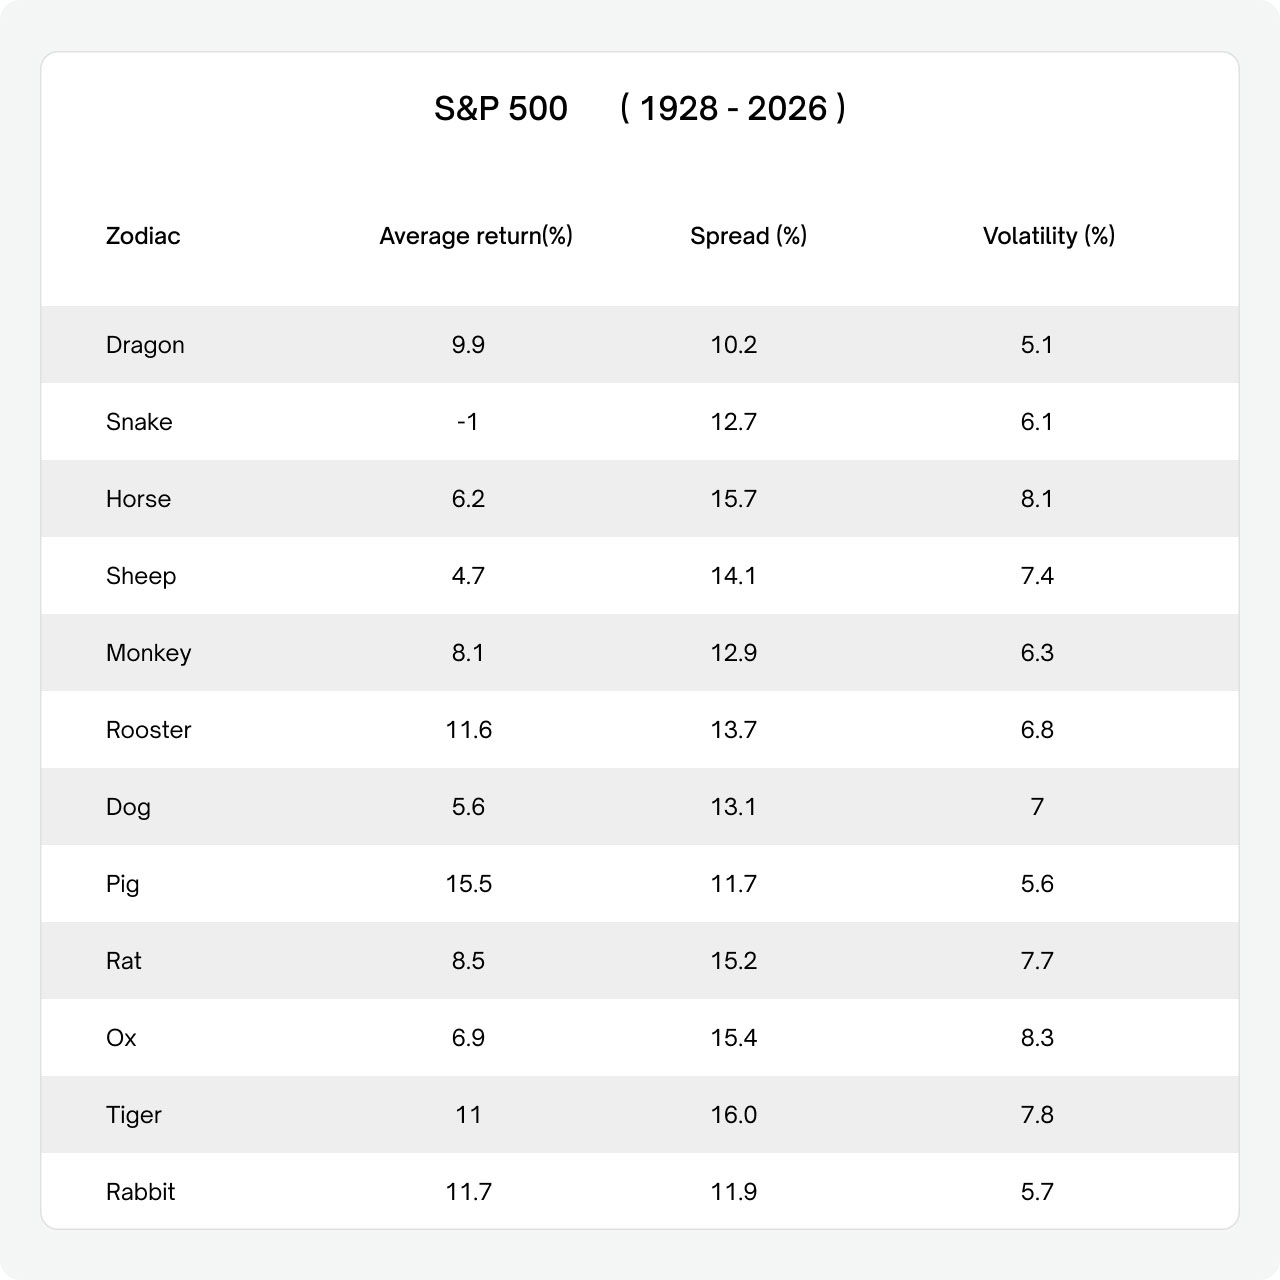
Several observations. Firstly, the horse is a consistently volatile year, beaten only by the ox. Secondly, there does not appear to be a clear relationship between performance and volatility, which is an interesting result in and of itself. Thirdly, with a low of 5.1% and a high of 8.3%, the spread between coefficients is meaningfully large.
Our current data set is far from ideal. To obtain a statistically significant result, we would need to roughly double our sample size, which we cannot do without waiting around for another century. The above results are in fact solid enough to suggest a trend, but not robust enough to demonstrate one.
Lunar performance of the Nikkei 225
Of course, the S&P 500 is only one index, for one stock market, in one country. Hard to establish global trends with such a limited data set. How do other markets fare according to the Chinese Lunar calendar? Unfortunately, this is where we rapidly encounter a problem. For most markets, the data simply do not exist over a meaningful time frame. Given the twelve-year cycle, a couple of decades of price information is just not enough. We can look up the daily close for the S&P 500 all the way back to 1928 without issue, but the same cannot be said for much else. We do have one overlooked exception however: the Japanese Nikkei 225, for which we have daily records stretching back to 1949. Repeating the same steps as above, we obtain the average results for each Chinese zodiac animal:
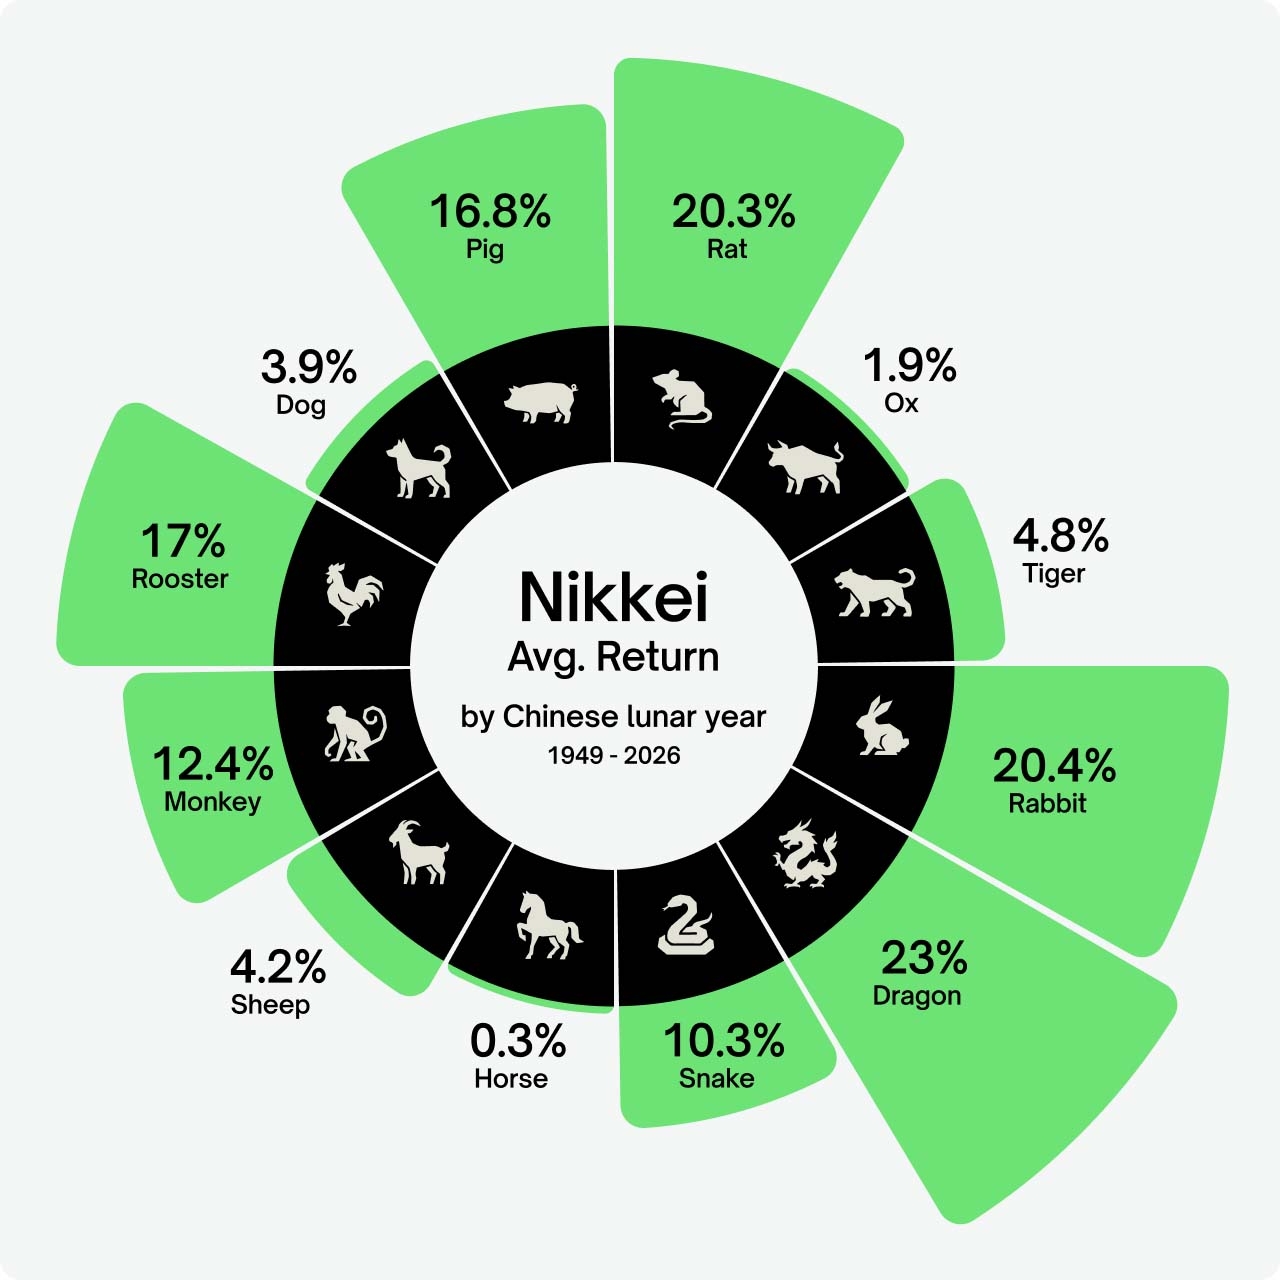
The first point to note is the wider spread of average returns compared to the S&P 500. The dragon, rat and rabbit can all boast average returns of over 20%, while the horse, sheep, dog, ox and tiger all fail to offer more than 5%. The second point of interest is the fact that our poor horse ranks rock bottom in terms of average returns. If previous results are anything to go by, investors would do well to get out of Japanese stocks as soon as possible. As with the S&P 500, we can also calculate the volatility for each period, using the same methodology as above:
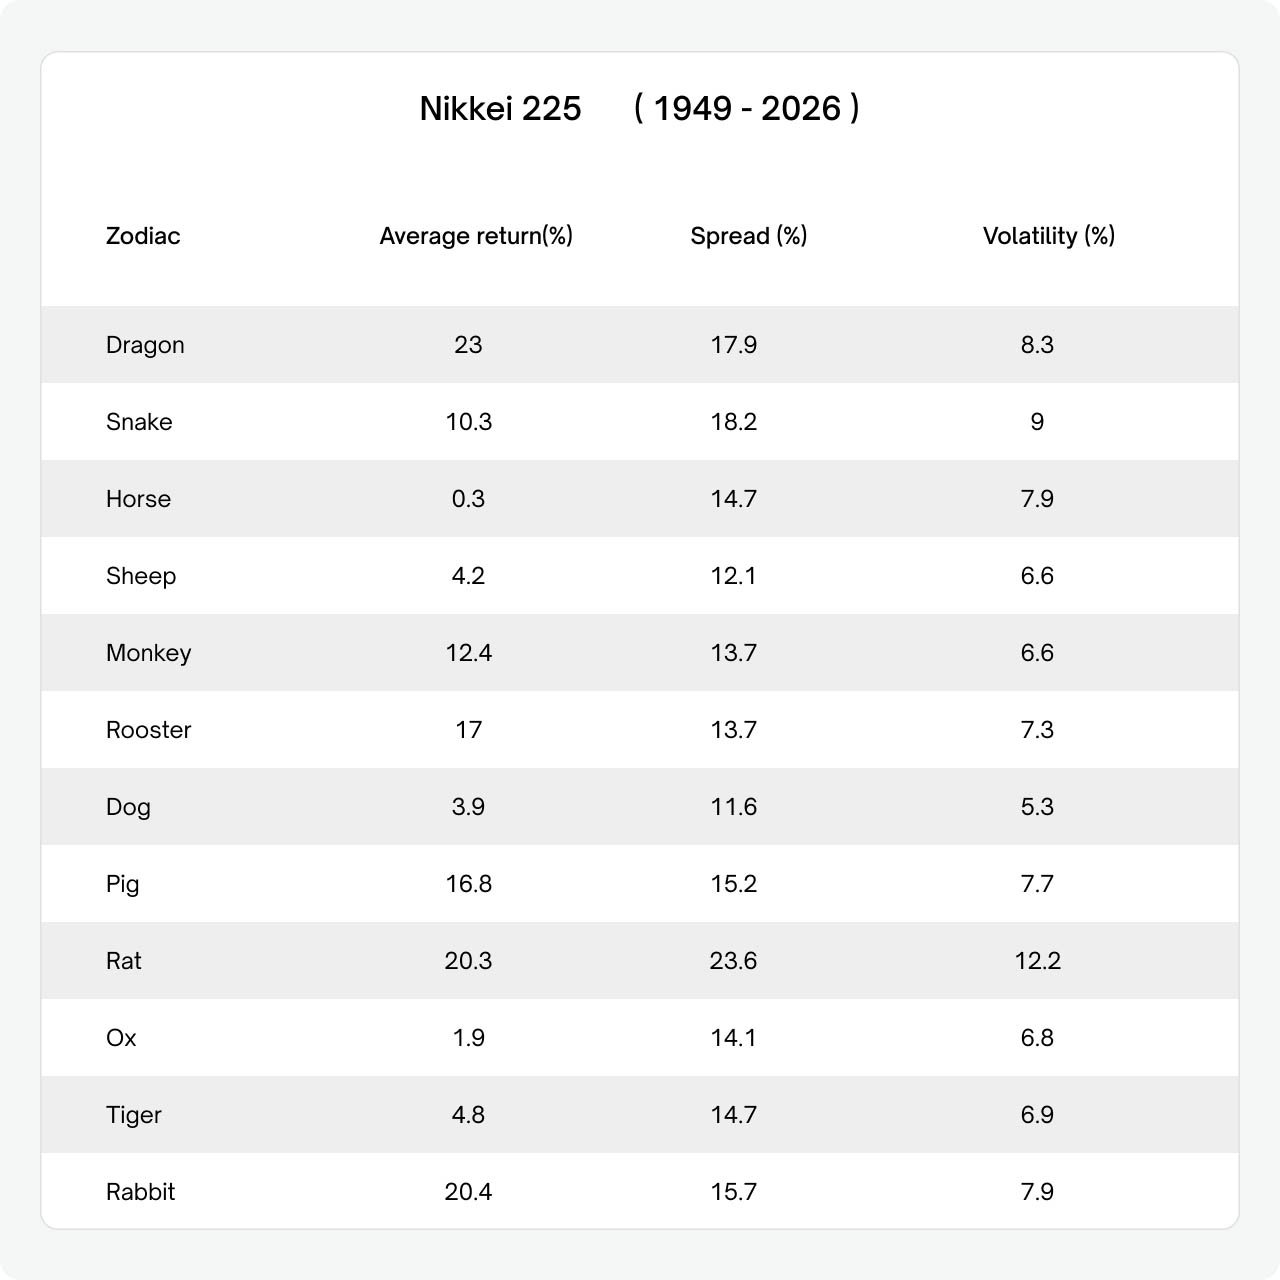
Once again, several observations. Firstly, the horse may be on the higher side, but this time is no longer an outlier. The dragon and snake are both more volatile, while the rat is in a league of its own. Secondly, unlike the S&P 500, there does appear to be a link between performance and volatility within the Japanese index. Thirdly, with a low of 5.3% and a high of 12.2%, this time the spread between coefficients is in fact statistically significant.
Interestingly, this suggests that changes in performance in the Nikkei 225 across lunar years are not random. Of course, this time around the sample size is even smaller than it was for the S&P 500, making the results extra sensitive to outliers. Nevertheless, a pattern has cautiously presented itself.
Final thoughts
Analysing the S&P 500 and Nikkei 225 indices according to Chinese lunar cycles reveals some interesting bits of information. The Japanese stock market appears to be more heavily tied to the lunar calendar than its American counterpart, with the dragon, rat and pig being particularly beneficial years. There is a possible explanation to this in how the two financial markets have historically performed. US markets have typically followed shorter, more frequent credit cycles, thereby smoothing over the results. On the other hand, the Japanese economy has followed much more prolonged boom and bust cycles, often lasting decades, with which the lunar cycle has happened to coincide.
Either way, if historical patterns are anything to go by, US markets are set for a volatile year. Turning to Benjamin Franklin this time: “by failing to prepare, you are preparing to fail”. Buckle up.


A negociação de derivados e produtos alavancados envolve elevado risco e pode resultar em perdas superiores ao seu investimento inicial. Leia os nossos Termos e Condições (T&C) e a Declaração de Divulgação do Produto (PDS) antes de negociar.
ABRIR UMA CONTA